Bringing sport science to HYROX.
HYROX has grown far faster than the evidence behind it. Athletes and coaches are making training decisions — what to prioritise, what to drop, where the hours actually go — largely on instinct, because until recently there was very little else to go on.
This site exists to change that. It brings together two kinds of evidence, laboratory testing and real race data, and turns them into tools and guidance you can use in your own training.
Laboratory testing
Endurance (lactate threshold, VO₂max, running economy), strength (maximal, explosive, reactive and strength endurance) and body composition, all measured under controlled conditions — to work out which of these actually explain a HYROX finish time, and which we have been overrating.
Real race data
Every individual result from the 2025/26 season: 332,000 athlete-races across 107 events. Solo divisions only — Open and Pro, men and women, every age group. Not a survey, not a sample, but what actually happened on the floor.
Drag it. Running is almost half of a HYROX at every level — the share only moves from 50% at 55 minutes to 47% at two hours. It is the single biggest lever anyone has, and the most commonly under-trained.
The Race Pace Calculator
Not a rule of thumb borrowed from distance running. Every number comes from either published physiology or a quarter of a million HYROX results.
Work out your race-day pace
Enter a recent run and get the pace to hold across all eight legs, your compromised-running targets, and a full station-by-station race plan for your goal time. If your goal needs running you don't have yet, it tells you that too — and how much time you'd need to find on the floor instead.
Research
What we know about HYROX so far, and what is still being worked out.
 Published
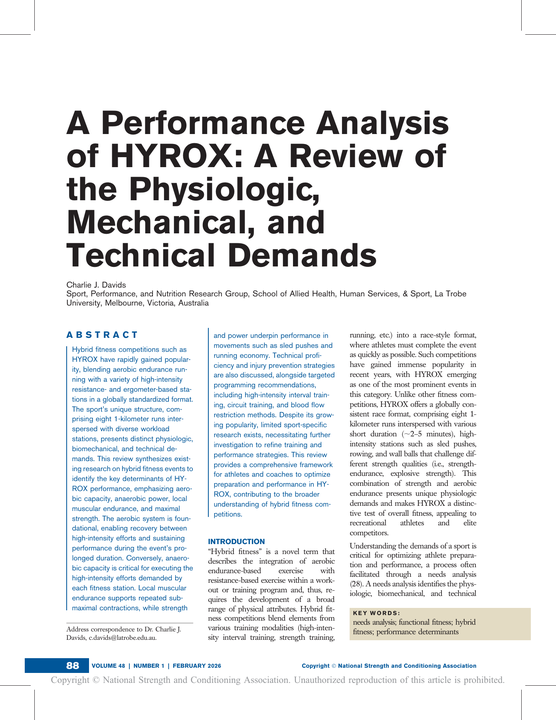
A Performance Analysis of HYROX: A Review of the Physiologic, Mechanical, and Technical Demands
The first comprehensive needs analysis of the sport. It sets out what HYROX actually asks of an athlete: aerobic capacity as the foundation, enabling recovery between stations and sustaining an hour-plus of work; anaerobic capacity for the high-intensity efforts each station demands; local muscular endurance for repeated submaximal contractions; and strength and power underpinning the sled work and running economy. It also covers technical proficiency, injury prevention, and programming — interval work, circuit training and blood flow restriction methods.
The honest conclusion of the review is the reason this site exists: despite the sport's growth, very little HYROX-specific research has been done.
What's being worked on now
Determinants of HYROX performance
A full laboratory battery measured against race performance, to establish which physical qualities genuinely explain finish time — and how much of it each one accounts for.
Is a sub-50-minute HYROX possible?
Where the theoretical ceiling of the sport sits, and whether reaching it is an endurance problem or a strength one.
The newsletter
Research translated into training decisions. Published on Substack and delivered to your inbox.
Get it in your inbox
Free. Research, data and training decisions for HYROX athletes and the people who coach them.
What 332,000 races tell you
Findings from the full 2025/26 season — 107 events, solo divisions. Aggregate only, no individual results.
Running is half the race
And it holds at 48–50% whether you finish in 55 minutes or 100. Nobody escapes the running.
Roxzone scales with you
Transitions cost four minutes at the sharp end and nearly eight at the back. It is not a rounding error.
The ergs give you seconds. The sleds and wall balls give you minutes.
Among athletes finishing within the same ten minutes, the gap between the strongest and weakest tenth is 1:35 across both ergs — but 3:16 on the sleds and 3:08 on wall balls.
Dr Charlie Davids
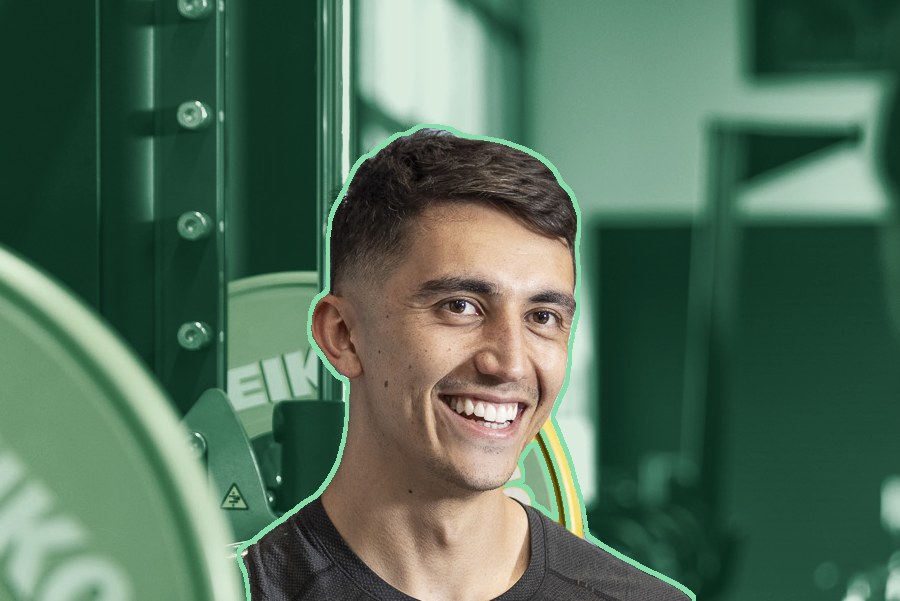
Dr Charlie Davids is a university lecturer and sport science researcher working to understand the performance determinants of HYROX. He holds a PhD in exercise physiology, and his work centres on the question the sport keeps raising: what happens when an athlete is asked to be strong and aerobically fit at the same time?
He competes in HYROX himself, which keeps the work honest. Everything published here has either been measured in a laboratory, found in the race data, or tested in training first.
Most HYROX advice is confidently asserted and never tested. Being in the unusual position of both conducting the research and competing in HYROX himself, he aims to provide value to coaches and athletes by sharing what the evidence shows and building tools that help them understand their own performance through the lens of sport science.
Any commercial interest relevant to what is published here is disclosed.